How Personality Differs by Age and Sex: Big Five Scores from 410,000 People
Compare the average Big Five profile of women and men at any age, trait by trait and facet by facet. Conscientiousness and agreeableness rise with age, neuroticism falls, and women score higher on agreeableness and neuroticism.
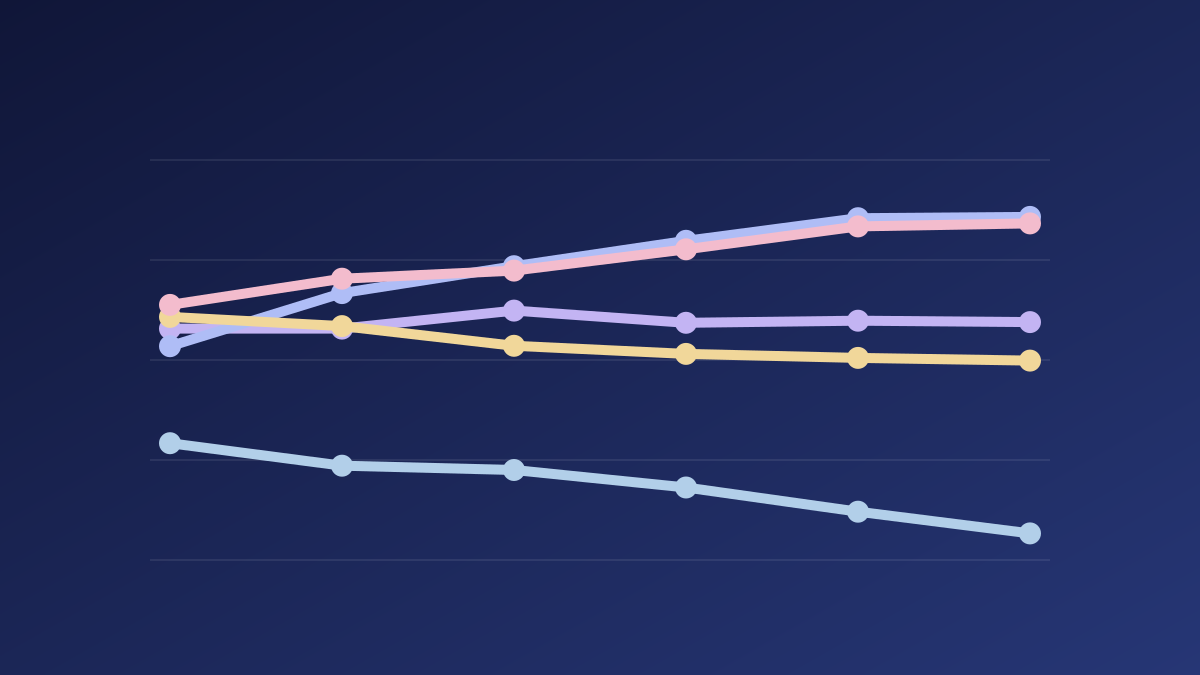
The short answer: Personality changes with age in a consistent direction. On average, older people are more conscientious, more agreeable and calmer than younger people, and they seek less excitement. Women score higher than men on agreeableness and neuroticism at every age. Below you can compare any two groups yourself, using the answers of 410,376 people who took the same test as you.
Key findings
- With age, conscientiousness and agreeableness rise and neuroticism falls. People over 55 are clearly more conscientious than people aged 18–24.
- The biggest age difference is in excitement-seeking: the wish for thrills and stimulation drops steadily from the teens onwards.
- Openness hardly changes with age on average.
- Women score higher on agreeableness (a moderate difference) and neuroticism (a small to moderate difference). Among the facets, the largest differences are in emotionality, sympathy, anxiety and vulnerability.
- Men score slightly higher on intellect, excitement-seeking and assertiveness, but these differences are small.
- Even where the difference is clearest, about 80% of women and men overlap. The groups differ on average, not person by person.
Explore the data
Pick two groups and compare their average profiles. The bars use the same percentage scale as your own result, so you can hold your scores up against them.
The biggest differences between Women, 25–34 and Men, 25–34 are in Emotionality, Anxiety, and Sympathy.
- Openness64% · 62%Hardly any difference94% of the two groups overlap
Facets
- Imagination66% · 68%Hardly any difference97% of the two groups overlap
- Artistic Interests71% · 64%Small difference · higher: Women, 25–3488% of the two groups overlap
- Emotionality76% · 64%Moderate difference · higher: Women, 25–3474% of the two groups overlap
- Adventurousness54% · 56%Hardly any difference95% of the two groups overlap
- Intellect68% · 73%Small difference · higher: Men, 25–3490% of the two groups overlap
- Liberalism49% · 46%Hardly any difference95% of the two groups overlap
- Conscientiousness69% · 67%Hardly any difference97% of the two groups overlap
Facets
- Self-Efficacy76% · 77%Hardly any difference99% of the two groups overlap
- Orderliness58% · 55%Hardly any difference96% of the two groups overlap
- Dutifulness78% · 74%Small difference · higher: Women, 25–3492% of the two groups overlap
- Achievement-Striving77% · 73%Small difference · higher: Women, 25–3492% of the two groups overlap
- Self-Discipline63% · 62%Hardly any difference98% of the two groups overlap
- Cautiousness59% · 63%Hardly any difference95% of the two groups overlap
- Extraversion59% · 59%Hardly any difference99% of the two groups overlap
Facets
- Friendliness64% · 62%Hardly any difference96% of the two groups overlap
- Gregariousness51% · 49%Hardly any difference97% of the two groups overlap
- Assertiveness64% · 68%Hardly any difference94% of the two groups overlap
- Activity Level56% · 52%Hardly any difference92% of the two groups overlap
- Excitement-Seeking50% · 54%Small difference · higher: Men, 25–3492% of the two groups overlap
- Cheerfulness70% · 68%Hardly any difference96% of the two groups overlap
- Agreeableness71% · 64%Moderate difference · higher: Women, 25–3478% of the two groups overlap
Facets
- Trust58% · 58%Hardly any difference99% of the two groups overlap
- Morality82% · 75%Small difference · higher: Women, 25–3484% of the two groups overlap
- Altruism82% · 74%Moderate difference · higher: Women, 25–3480% of the two groups overlap
- Cooperation72% · 67%Small difference · higher: Women, 25–3491% of the two groups overlap
- Modesty55% · 45%Small difference · higher: Women, 25–3481% of the two groups overlap
- Sympathy73% · 63%Moderate difference · higher: Women, 25–3479% of the two groups overlap
- Neuroticism48% · 41%Small difference · higher: Women, 25–3484% of the two groups overlap
Facets
- Anxiety56% · 43%Moderate difference · higher: Women, 25–3479% of the two groups overlap
- Anger51% · 44%Small difference · higher: Women, 25–3490% of the two groups overlap
- Depression38% · 33%Small difference · higher: Women, 25–3492% of the two groups overlap
- Self-Consciousness50% · 47%Hardly any difference96% of the two groups overlap
- Immoderation53% · 49%Hardly any difference94% of the two groups overlap
- Vulnerability42% · 31%Moderate difference · higher: Women, 25–3480% of the two groups overlap
OpennessConscientiousnessExtraversionAgreeablenessNeuroticism
Age group
Show the numbers
| Group | Openness | Conscientiousness | Extraversion | Agreeableness | Neuroticism | People |
|---|---|---|---|---|---|---|
| Everyone, All ages | 62% | 66% | 61% | 67% | 45% | 410,376 |
| Everyone, 10–17 | 61% | 59% | 62% | 64% | 48% | 70,399 |
| Everyone, 18–24 | 61% | 65% | 61% | 67% | 46% | 194,833 |
| Everyone, 25–34 | 63% | 68% | 59% | 68% | 45% | 82,219 |
| Everyone, 35–44 | 62% | 71% | 58% | 70% | 43% | 36,641 |
| Everyone, 45–54 | 62% | 73% | 58% | 73% | 40% | 19,536 |
| Everyone, 55+ | 62% | 74% | 57% | 73% | 38% | 6,748 |
| Women, All ages | 63% | 66% | 61% | 70% | 48% | 241,930 |
| Women, 10–17 | 62% | 60% | 63% | 67% | 50% | 43,475 |
| Women, 18–24 | 62% | 66% | 62% | 69% | 49% | 114,060 |
| Women, 25–34 | 64% | 69% | 59% | 71% | 48% | 46,887 |
| Women, 35–44 | 63% | 72% | 59% | 73% | 45% | 21,785 |
| Women, 45–54 | 63% | 74% | 58% | 75% | 42% | 12,026 |
| Women, 55+ | 63% | 74% | 58% | 76% | 40% | 3,697 |
| Men, All ages | 60% | 65% | 60% | 63% | 42% | 168,446 |
| Men, 10–17 | 59% | 58% | 61% | 59% | 44% | 26,924 |
| Men, 18–24 | 60% | 64% | 61% | 63% | 41% | 80,773 |
| Men, 25–34 | 62% | 67% | 59% | 64% | 41% | 35,332 |
| Men, 35–44 | 60% | 70% | 58% | 66% | 41% | 14,856 |
| Men, 45–54 | 61% | 72% | 57% | 68% | 38% | 7,510 |
| Men, 55+ | 61% | 73% | 57% | 69% | 36% | 3,051 |
Data: 410,376 people who completed the IPIP-NEO-120 online in 2001–2011, mostly in English (Johnson, 2014). Differences are shown as Cohen's d: under 0.2 hardly any, 0.2–0.5 small, 0.5–0.8 moderate, above 0.8 large.
Where the data comes from
The numbers come from John A. Johnson's research data for the IPIP-NEO-120, the same 120 statements as our test. Between 2001 and 2011, more than 600,000 people took the test on his website. We use the 410,376 who answered every statement, and group them by sex and age (Johnson, 2014).
Two caveats matter. First, these are people who chose to take a personality test online, mostly in English and mostly in the United States, Canada, the United Kingdom and Australia. They are not a random sample of the population. Second, the age groups are different people, not the same people followed over time. Part of an age difference can therefore come from growing up in a different time.
That is also why the IPIP project, which publishes the statements, does not offer official norms. Treat the numbers as a well-founded picture, not as an exact measure for any one country.
Personality matures
That conscientiousness and agreeableness rise and neuroticism falls through adulthood is one of the best-documented findings in personality research. It is often called the maturity principle: on average, people become more responsible, more considerate and more emotionally stable as they take on work, relationships and family.
The pattern is not limited to this data. A meta-analysis of 92 samples that followed the same people over time found the same direction of change, with the largest changes between the ages of 20 and 40 (Roberts, Walton & Viechtbauer, 2006). A study of more than a million people aged 10 to 65 found that the changes start in the late teens (Soto et al., 2011).
The averages hide large individual differences. Many young people are very conscientious, and many older people are restless thrill-seekers. Personality also changes on purpose: people who want to change a trait often manage to, at least in part.
Women and men
The differences between women and men in this data match what large international studies find: women score higher on agreeableness and neuroticism, and the differences in the other three traits are small. You can read more about the research, and why the differences are largest in the most gender-equal countries, in Are women's personalities different from men's?
The difference also holds within each age group. Compare women and men aged 25–34 above, and you will see almost the same pattern as for all ages together.
Agreeableness shows the same gap at every age. Neuroticism does not: among people aged 18–34, women score about 7 percentage points higher than men, but after 45 the gap is about half that. In the age chart above, choose Women and men to see the two neuroticism lines come closer together.
What this means for your result
Your result now shows a percentile under each trait: how many in a group of your choice scored lower than you. The groups and the data are the same as here. Have you not taken the test yet? It is free and takes about 10 minutes.
Sources
- Johnson, J. A. (2014). Measuring thirty facets of the Five Factor Model with a 120-item public domain inventory: Development of the IPIP-NEO-120. Journal of Research in Personality, 51, 78–89. Data on OSF.
- Roberts, B. W., Walton, K. E., & Viechtbauer, W. (2006). Patterns of mean-level change in personality traits across the life course: A meta-analysis of longitudinal studies. Psychological Bulletin, 132(1), 1–25. doi:10.1037/0033-2909.132.1.1
- Soto, C. J., John, O. P., Gosling, S. D., & Potter, J. (2011). Age differences in personality traits from 10 to 65: Big Five domains and facets in a large cross-sectional sample. Journal of Personality and Social Psychology, 100(2), 330–348. doi:10.1037/a0021717
- International Personality Item Pool: Norms.